Four different system models are offered and explained in detail in this article.
Feb 14th, 2024
Allocation, cut-off by classification
Allocation at the point of substitution
Substitution, consequential, long-term
System models set the methodological rules to calculate the life cycle inventories (LCIs) of products and service activities (Undefined Unit Processes (UPR)), and apply different assumptions to determine the supply (linking) and the distribution of impacts between producers and consumers of products and services (allocation and substitution).
Different system models, namely, “Allocation, cut-off by classification”, “Allocation, cut-off, EN15804”, “Allocation at the point of substitution” and “Substitution, consequential, long-term”, are offered to meet the demand of different types of studies. “Allocation, cut-off by classification” and “Allocation at the point of substitution” differ solely in the way they treat waste and recyclable materials. This factor is reflected in the resulting impact scores, which are otherwise quite similar.
The choice of system model is the responsibility of the user. Users should understand the assumptions of the system model they choose to ensure that it serves the goal and scope of their study. For users new to the database, ecoinvent recommends using the cut-off system model when starting to work with ecoinvent version 3. This model is easier to understand for first-time users. The cut-off system model applies the same modelling choices as ecoinvent versions 1 and 2 and is therefore also recommended for experienced users looking for continuity with their previous work.
Key Concepts
Key Concepts: Subdivision, Allocation, and Substitution
Subdivision
Before allocation and substitution is applied, subdivision can come to place. In those activities, more than one reference product is defined, and inputs and emissions are split among products based on various physical characteristics. This is applied for all system models.
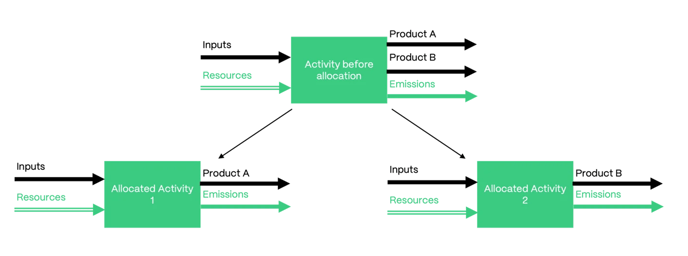
Allocation
Allocation is the method applied in the attributional approach to convert multi-product activities into single-product activities. It is therefore relevant for “Allocation, cut-off by classification” and “Allocation at the point of substitution”. The allocation key determines the share of each input and emission assigned to the reference product and to the by-products that have economic value. The ecoinvent database relies on economic allocation (i.e., allocation based on price) with few exceptions, such as for energy, for which allocation is based on exergy.
Substitution
Substitution is the method applied to convert multi-product activities into single-product activities in the consequential system model. Substitution moves all by-products to the input side with a negative sign (to maintain mass balance). By-products that can substitute other productions provide credits to the activity producing them.
Allocation cut-off by Classification
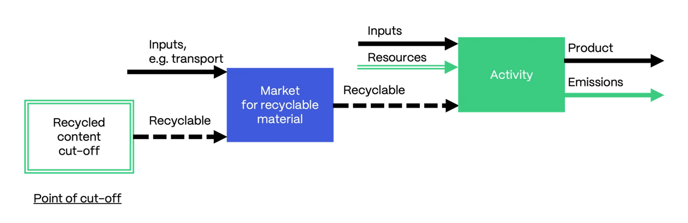
The system model “Allocation, cut-off by classification”, or the cut-off system model, is based on the recycled content, or cut-off, approach. In this system model, wastes are the producer’s responsibility (“polluter pays”), and there is an incentivisation to use recyclable products, that are available burden free (cut-off).
Introduction to the cut-off System Model
The underlying philosophy of this approach is that primary (first) production of materials is always allocated to the primary user of a material. If a material is recycled, the primary producer does not receive any credit for the provision of any recyclable materials. As a consequence, recyclable materials are available burden-free to recycling processes, and secondary (recycled) materials bear only the impacts of the recycling processes. For example, recycled paper only bears the impacts of waste paper collection and the recycling process of turning waste paper into recycled paper. It is free of any burdens of the forestry activities and processing required for the primary production of the paper.
The cut-off system model distinguishes between waste and recyclables. Similar to recyclables, producers of waste do not receive any credit for recycling or reuse of products resulting from any waste treatment. For example, heat from the incineration of municipal solid waste can be used to heat houses or offices and therefore has value. Nevertheless, the incineration is allocated completely to the treatment of the waste; therefore, the burden is assigned to the waste producer while the heat comes burden-free.
This approach to by-product allocation was also used in ecoinvent versions 1 and 2, where it was the only available system model.
Classification of Products
In the cut-off system model, all intermediate exchanges (i.e., flows from the technosphere) in the database are classified into one of 3 categories: allocatable, recyclable, or waste. This classification determines how such exchanges will be handled during allocation. The classification is at the product level, not the individual activity level: throughout the database, an intermediate exchange can be used and produced many times in many activities, but the classification of each (identified clearly by name) is consistent throughout the entire database.
A product name may imply a certain category, but classification is not always obvious. For example, waste paper may be classified as a recyclable material, yet the name contains the term waste for clarity. A full list of all products and their classifications is available on the ecoinvent website, and the datasets contain classifications of their products. The classifications are based on the perspective of the data provider and the judgment of the ecoinvent experts and editors. The choice is made based on the use and fate of the product within the ecoinvent database.
Allocatable Products
Most goods produced fall into this category. Allocatable products are ordinary (by-)products; they have economic value and therefore are included in the allocation. Examples of allocatable products include heat and electricity.
Recyclable Materials
Materials with no or little economic value can serve as the input or resource for a recycling activity; therefore, interest in their collection exists. Examples include metal scraps and waste paper.
Waste Products
Waste products are materials with no economic value and no interest in their collection without compensation. The producer therefore generally has to pay to dispose of these materials; thus, he consumes the service of disposing of these materials. Examples are wastewater, chemically polluted soil, and radioactive waste.
Handling of By-Products by Classification
The cut-off system model has, broadly speaking, the effect that recyclable materials are cut off at the beginning of the treatment processes, becoming available burden-free for following uses. The treatment of waste is completely allocated to the waste producer, and all valuable by-products of waste treatment are cut off in the waste treatment and become available burden-free. Ordinary by-products are handled by allocation among products if an activity produces more than one product.
The following sections describe in more detail what happens to by-products in this system model.
Handling of Waste Products
Waste by-products have to be treated, and the treatment burden is allocated completely to the waste-producing activity. Therefore, wastes are linked as a negative input to the activity, representing the fact that the activity requires the service of waste disposal. Waste disposal is then provided by different treatment processes, which have inputs and emissions that add to the burden of the waste-producing activity.
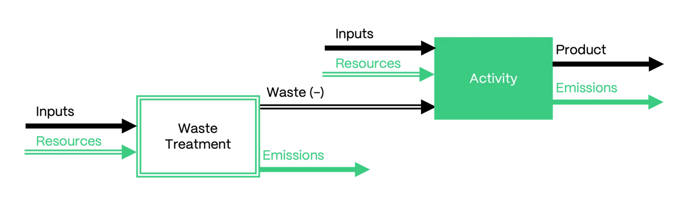
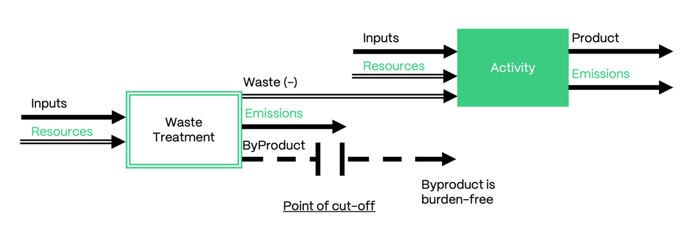
Any non-waste by-products of a waste treatment process (i.e., not other waste products) are cut off and do not provide credit to the production activity. The cut-off point is therefore the end of the waste treatment, which means that the resulting products are available in the database and can be used as burden-free inputs in other activities.
Handling of Recyclable Materials
Recyclable materials are cut off from their production activities through the use of special datasets, denoted as “product name, recycled content cut-off”. These datasets have no inputs or emissions and are therefore burden-free. In a production activity, the material is recorded as a negative input, as in the case of waste; however, the material is not linked to any treatment activity but simply to the empty process.
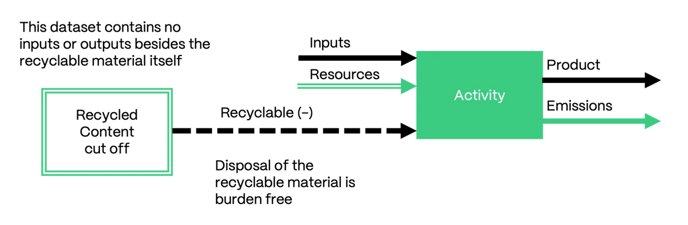
Thus, the cut-off approach is simple on the producing side. The cut-off point is at the end of the activity producing the recyclable material. The secondary use cycle begins with pick-up of the material from the producer, and transport to the processing site is the beginning of the supply chain. In the system model, a process requesting a recyclable material as an input, e.g., a recycling process, receives the product from its market, which links to the burden-free recycled content cut-off dataset.
Special Case: Recycling Chains
Recycling processes can occur over several linked unit processes. Often, the cut-off simply occurs at the beginning. However, recycling products are sometimes produced in different forms during a recycling process. This case is best explained with an example. Waste glass is first treated by processing it and breaking it down into glass cullets, which are recyclable materials that can be turned into glass bottles. In this example, both waste glass and glass cullets are considered recyclable materials, so other producers producing either of them will have these by-products cut off. For recycling, however, the system model maintains the recycling chain, so glass cullets will have a non-empty supply chain despite being a recyclable material. The glass cullet supply chain will lead all the way to the beginning of the secondary use cycle, with the collection of waste glass, and there is no cut-off between waste glass and glass cullets.
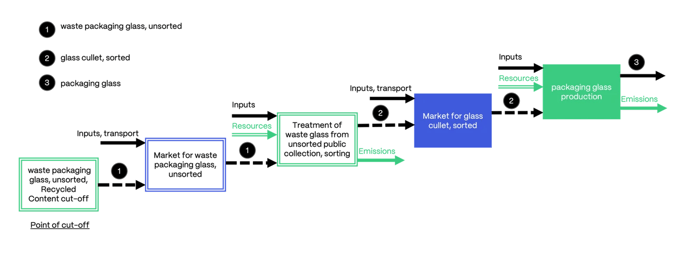
An example for a recycling chain as present in version 3.7.1. of the ecoinvent database.
Handling of Allocatable Products
After the handling of waste and recyclable materials, allocation occurs for all remaining allocatable by-products produced within the activity. This process uses the allocation factors defined in the dataset by the dataset author. As waste and most recyclable materials (except those within recycling chains, where they remain as products) are at this point moved to the input side of the activity, they will be considered similar to other inputs and allocated over the different co-products of the activity.
Allocation, cut-off, EN15804
The system model Allocation, cut-off, EN15804 has been developed to support the needs of Environmental Product Declaration (EPD) practitioners. The system model is compliant with an attributional interpretation of EN15804, ISO21930, and ISO14025. It provides all Life Cycle Inventory (LCI) indicators required by the aforementioned standards and adheres to the end-of-waste criteria set by the European Commission.
Introduction to the Allocation, cut-off, EN15804 System Model
The Allocation, cut-off, EN15804 system model follows the underlying principles of the cut-off approach. The classification of exchanges into allocatable, recyclable, and waste determines the fate of the exchanges during allocation. Similar to the cut-off system model, producers of waste bear the burden of the waste treatment, based on the “polluter pays” principle. Consumers of recycled products receive them burden-free.
The key differences of the Allocation, cut-off, EN15804 to the Allocation, cut-off by classification system model are
- The cut-off point between the primary and secondary system
- The calculation of the inventory indicators required in EPDs
Cut-off Point Between the Primary and Secondary System
The cut-off point between the primary and secondary system complies with the end-of-waste criteria of the standard EN15804&A2:2019. Based on the standard, a product reaches its end-of-waste state when there is a market for the recovered product and when the recovered product fulfills the technical requirements for the specific purposes and meets the legislation and standards applicable to the product. Following this guidance, the cut-off point in some supply chains has been adjusted to align with the end-of-waste criteria. In these cases, the product classifications have been modified, when necessary, to align with the new cut-off point. Figures 1 and 2 show an example of the cut-off point for the treatment of waste paper in the “Allocation, cut-off by classification” and how the cut-off point is modified in “Allocation, cut-off, EN15804”. 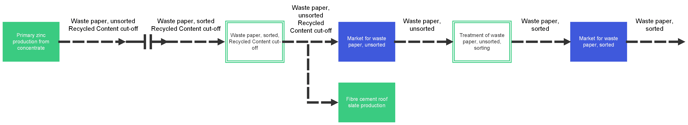
Figure 1. System boundaries of primary (producer of waste) and secondary system (consumer of recycled material). In the "allocation, cut-off by classification’ system model", the cut-off point in the supply chain of treatment of waste paper, unsorted is located after the production of waste paper, unsorted.
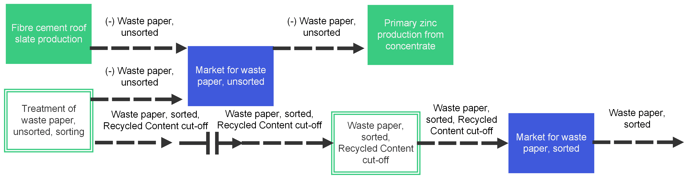
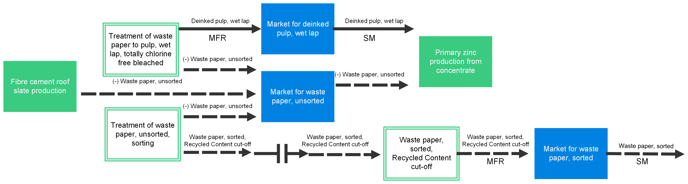
Figure 2. System boundaries of primary (producer of waste) and secondary system (consumer of recycled material). In the "allocation, cut-off, EN15804 system mode"l, the cut-off point in the same supply chain is located after the sorting activity.
Further processing that may be required after the material has reached its end-of-waste state does not belong to the primary system. For example, recycling activities at the refiner or the remelter, are beyond the end-of-waste.
Calculation of the Inventory Indicators Required in EPDs
The “Allocation, cut-off, EN15804 system model” provides all Life Cycle Inventory (LCI) indicators required in EPDs. The indicators describe resource use, waste categories, and output flows, and provide information on biogenic carbon content. The list below provides an overview of the LCI indicators included in the system model:
- Use of secondary material
- Renewable and non-renewable secondary fuels
- Materials for recycling
- Materials for energy recovery
- Exported energy (electricity, heat)
- Recovered energy
- Use of renewable and non-renewable primary energy resources used as raw materials
- Use of renewable and non-renewable primary energy excluding renewable primary energy resources used as raw materials
- Total use of renewable and non-renewable primary energy resources
- Use of net freshwater
- Hazardous and non-hazardous waste disposed
- Intermediate and low-level radioactive waste disposed
- High-level radioactive waste disposed
- Biogenic carbon content in product and in accompanying packaging
To model these indicators, elementary exchanges and properties have been used, depending on whether the indicator is a characteristic respectively of the process (e.g. use of secondary material) or the product (e.g. biogenic carbon). The indicators are calculated considering the cut-off point defined in the previous paragraph. For example, the resource output flows are calculated on the amounts “leaving the system boundary when they have reached their end-of-waste state”.
The following example shows the flows that are considered in the calculation of the two indicators, Materials for recycling (MFR) and Use of secondary material (SM), in the supply chain of treatment of waste paper, unsorted. The products waste paper, sorted and deinked pulp, and wet lap have reached the end-of-waste state after being submitted to the treatment activities. Both indicators are calculated at this point of cut-off.
Allocation at the Point of Substitution
The system model “Allocation at the point of substitution” is also known as the APOS system model. It follows an attributional approach in which the responsibility over wastes (burdens) is shared between producers and subsequent users benefiting from the treatment processes by using valuable products generated in these.
The APOS system model was previously called “allocation, ecoinvent default”. The name was changed with the release of ecoinvent version 3.2.
Introduction to the APOS System Model
The Allocation at the point of substitution (APOS) system model uses expansion of product systems to avoid allocation within treatment systems. Some activities, e.g., collecting municipal solid waste and driving it to a disposal site, occur within treatment systems, and finding appropriate allocation factors, such as revenues, for these individual steps can be challenging. APOS was designed to avoid such allocations in general, instead allocating the valuable by-products of treatment systems together with the activity that produced the material for treatment (i.e. waste). Such an expansion of the product system is often impossible in foreground systems due to the scope of a given study.
Classification of Products
In the APOS system, model products are classified as material for treatment (mft) or material not for treatment (non-mft). A material for treatment is a product that requires treatment in general, i.e. waste, or to become valuable for a subsequent processing step, i.e., recyclable material. A non-mft is a valuable product that does not require any further processing before use.
Handling of By-Products by Classification
Handling of Materials not for Treatment
In an activity where all reference products and by-products are non-mft, inputs and emissions are allocated based on the allocation factors.
In the APOS system, model products are classified as material for treatment (mft) or material not for treatment (non-mft). A material for treatment is a product that requires treatment in general, i.e. waste, or to become valuable for a subsequent processing step, i.e., recyclable material. A non-mft is a valuable product that does not require any further processing before use.
Handling of Materials for Treatment
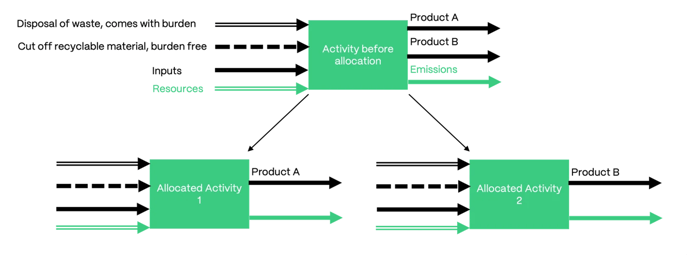
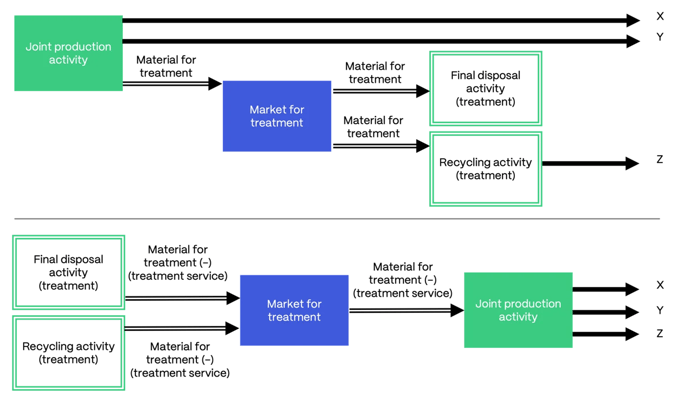
The underlying philosophy of this approach is that allocation within end-of-life, i.e., within treatment activities, should be avoided. To do so, each activity that produces a product that requires further treatment before becoming valuable (e.g., waste) is considered together with all treatment activities required for that product in a single system. The exchanges of the producing activity and those of the treatment activities are then allocated to all the different valuable by-products in the system (from both producing and treatment activities). The point of substitution lies therefore in the first activity in the downstream supply chain after a treatment (or recycling) activity that produces a valuable product.
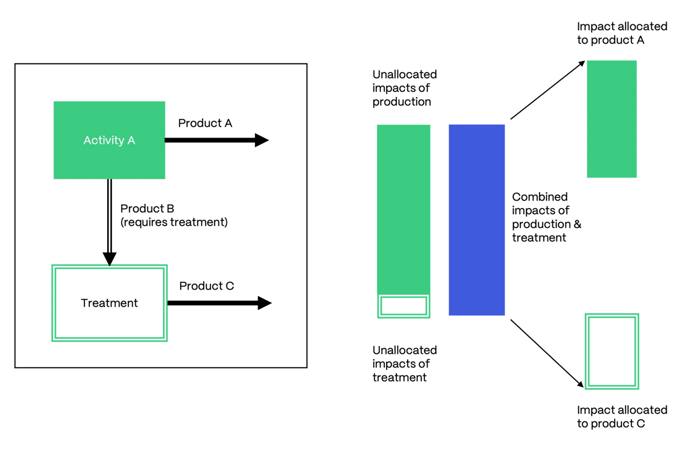
A visual representation of the expanded allocation system in the APOS system model. The impacts of the production and treatment process are combined and allocated to product A and the treatment by-product C. Adapted from Wernet G., Bauer C., Steubing B., Reinhard J., Moreno Ruiz E., Weidema, B. (2016) The ecoinvent database version 3 (part I): overview and methodology. International Journal of Life Cycle Assessment.
Example
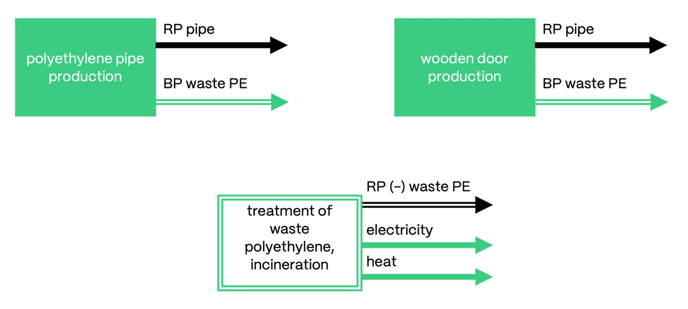
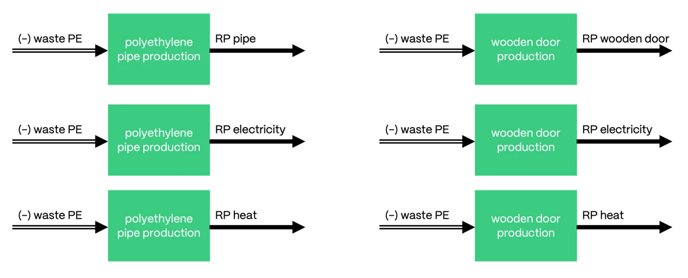
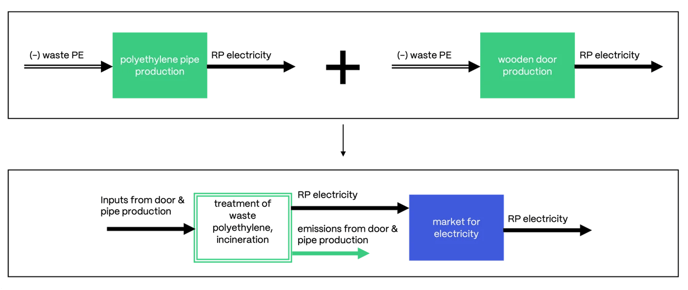
Let us consider a situation where we have two activities: “polyethylene pipe production” and “wooden door production”. Both activities produce the same by-product, “waste polyethylene”, which is an mft. A number of activities representing the end-of-life of polyethylene exist, including incineration. Incineration produces two by-products, “electricity” and “heat”, which are both valuable products classified as non-mft.
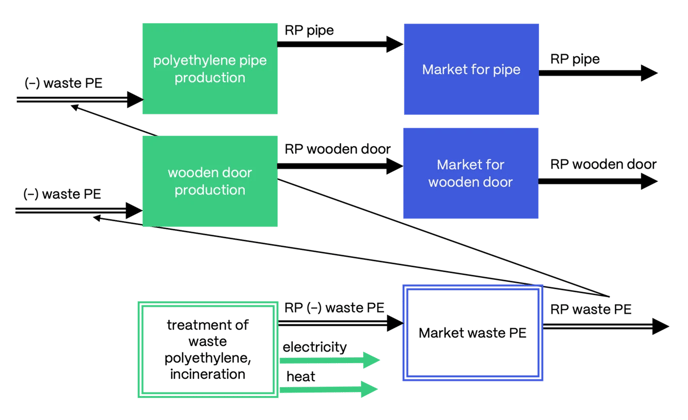
 During the calculation of the APOS system model, mft moves to the input side with a negative sign (to maintain the mass balance). Products supply their respective markets, which then meet the demand. The activity for waste PE incineration will therefore supply the market for waste PE, which will in turn meets the demand for treatment of both pipe and door production.
In the following step, the non-mft by-products of the treating activities become by-products of the activities producing the mft: electricity and heat (valuable/marketable products) move to the output side of pipe and door production.
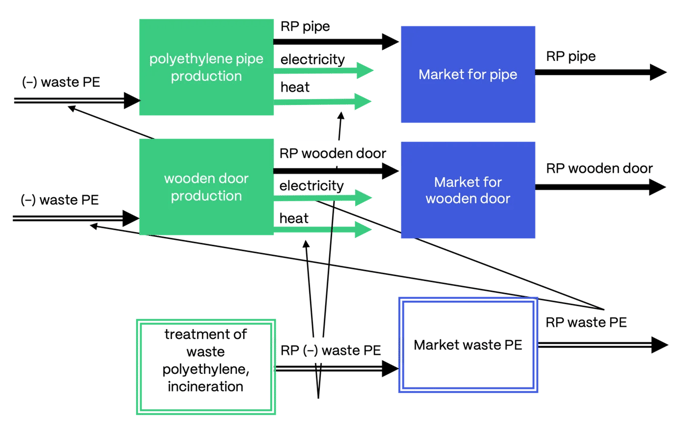
The activity then behaves as a “conventional” joint production. Allocation will therefore apply to all valuable products (e.g., pipe/electricity/heat & door/electricity/heat).
After allocation, all activities created in this way and producing the same product are merged into a single activity carrying the name of the original mft treatment (e.g., treatment of waste polyethylene, incineration). These activities have inputs and emissions from the activities to which the non-mft by-products were moved. Thus, the “treatment of waste polyethylene, incineration”, producing electricity, will have inputs and emissions of, for example, the pipe production, and the door production. The products pipe, door, electricity, and heat still feed their respective markets.
In summary, this activity now carries many different exchanges from different activities, which is particularly relevant for waste produced in many different industries. Waste polyethylene, for example, is also a by-product of certain agricultural activities, as it represents the waste of plastic mulch film; the incineration activities might therefore also include inputs, such as irrigation, and emissions, such as nitrate. This expansion also operates over treatment chains. If there are multiple treatment activities linked together, all non-mft by-products along that chain will undergo the same process described above.
Substitution, Consequential, Long-term
The system model “Substitution, consequential, long-term” is also known as the consequential system model. This model uses different basic assumptions to assess the consequences of a change in an existing system. It applies substitution to credit processes with the avoided burdens from supply chains that are replaced by the by-products generated within them.
Introduction to the Consequential System Model
The consequential system model uses different basic assumptions to assess the consequences of a change in an existing system. The model can be used for perspective studies and prediction of future changes. The key concepts of the consequential system model are the application of substitution to resolve multi-functionality and the use of only marginal supply.
In the consequential system model, all by-products are moved to the input side with a negative sign to maintain the mass balance. As no allocation is applied, the activity is burdened with the impact of all its inputs and emissions. By-products that can substitute other production bring credit to the activity producing them, as they displace part of the product that would have otherwise been produced as a reference product. For example, the production of electricity from incineration processes feeds energy to the grid that would have otherwise been produced by other sources, such as the combustion of fossil fuels.
Marginal Supply
An unconstrained or marginal supplier can meet an increase in demand by increasing supply. The supply of a product is unconstrained as long as there is at least one activity producing it as a reference product. In consequential thinking, that means that conducting that activity makes economic sense as the market will absorb the supply.
A constrained supplier cannot meet an increase in demand by increasing supply. Products that are produced only as by-products are constrained. By-products are not the economic drivers of an activity; therefore, it does not make economic sense to increase production to meet demand.
Supply can also be constrained due to technological level. In the ecoinvent database, each activity is assigned a technological level:
- Outdated technologies are no longer used.
- Old technologies are taken out of use (less economically competitive technology).
- Current technologies are between modern and old.
- Modern technologies are currently used when installing new capacity (most economically competitive technology).
- New technologies are technically superior to modern technologies but are not yet commonly installed as they are not yet economically competitive.
Only the most up-to-date technologies are considered unconstrained.
The marginal supply therefore comprises products that are reference products of at least one activity that has an up-to-date technology level.
Example
In the early 2000s, liquid crystal displays (LCDs) reached the same image quality as cathode-ray tubes (CRTs) and started dominating the market (source). In the consequential system model, the technological level of CRTs is therefore set to old, and increases in the production and use (operation) of screens will be met by LCD screens only.
Marginal Supply in Electricity
In version 3.4, a specific electricity market for the consequential system model was introduced. The marginal mixes represent the consequence of an increase in demand on the construction and operation of new electricity generating technologies. The mixes are specific to 40 countries, which together represent 77% of the global energy output. These mixes are based on projections from (inter-)national authorities such as the European Commission (2016) and the International Energy Agency (2016).
Read more about how the consequential mixes have been created here.
Handling of a Substitution and Constrained Markets
A market is constrained if there is no unconstrained supplier; the supply is therefore not fully elastic. Thus, an increase in demand will not be met by an increase in supply but rather by a reduction in consumption. The marginal consumer will demand less of the product in case of reduced supply.
Example
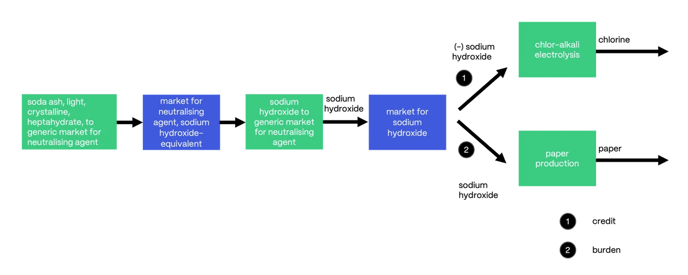
Sodium hydroxide is produced only as a by-product of chlorine production; the market is therefore constrained. To solve the system, the marginal consumption needs to be identified. Sodium hydroxide is used as a neutralising agent and can easily be substituted by another substance, such as soda ash.
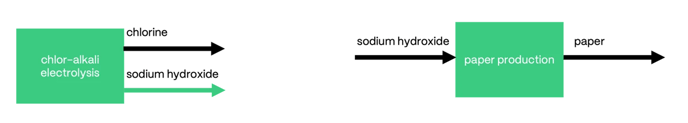
The producer of sodium hydroxide receives credit for reducing marginal consumption. This means that chlorine production receives credit for providing sodium hydroxide and therefore avoiding the production of soda ash (substitution). On the other hand, activities that demand sodium hydroxide trigger the production of soda ash and are therefore burdened by its impacts.