The chemicals and plastics sector touches nearly every aspect of modern life: from plastics to paints, adhesives, solvents, agrochemicals, rubber, and more. Every update in this sector furthers our mission to enable people and organizations to make science-based, data-driven sustainability decisions.


In recent years, our data in this sector has seen substantial growth in geographical coverage, transparency, and CAS (Chemical Abstracts Service) coverage, reflecting the work of the chemicals and plastics team, led and coordinated by Iasonas Ioannou, Database Content Lead and chemicals data expert.


This development can support sustainability teams across a range of applications, from making better-informed decisions and identifying potential opportunities, to responding to changing circumstances and preparing for future needs.


Keep reading for Iasonas’ reflections on four years of development in ecoinvent chemicals and plastics data.

 

Iasonas' Reflections

What Changes When an LCI Database Is Updated?

When you are focused on one database release after another, it can be easy to lose sight of how much has changed over time.


So, I pulled together a few numbers from ecoinvent v3.9 to v3.12 to visualize the development of chemicals and plastics across these releases. Timewise, this covers the data released from v3.9 in 2022 to v3.12 in 2025.


And there is quite a bit to see.

Iasonas Blog Image Portrait and Job title

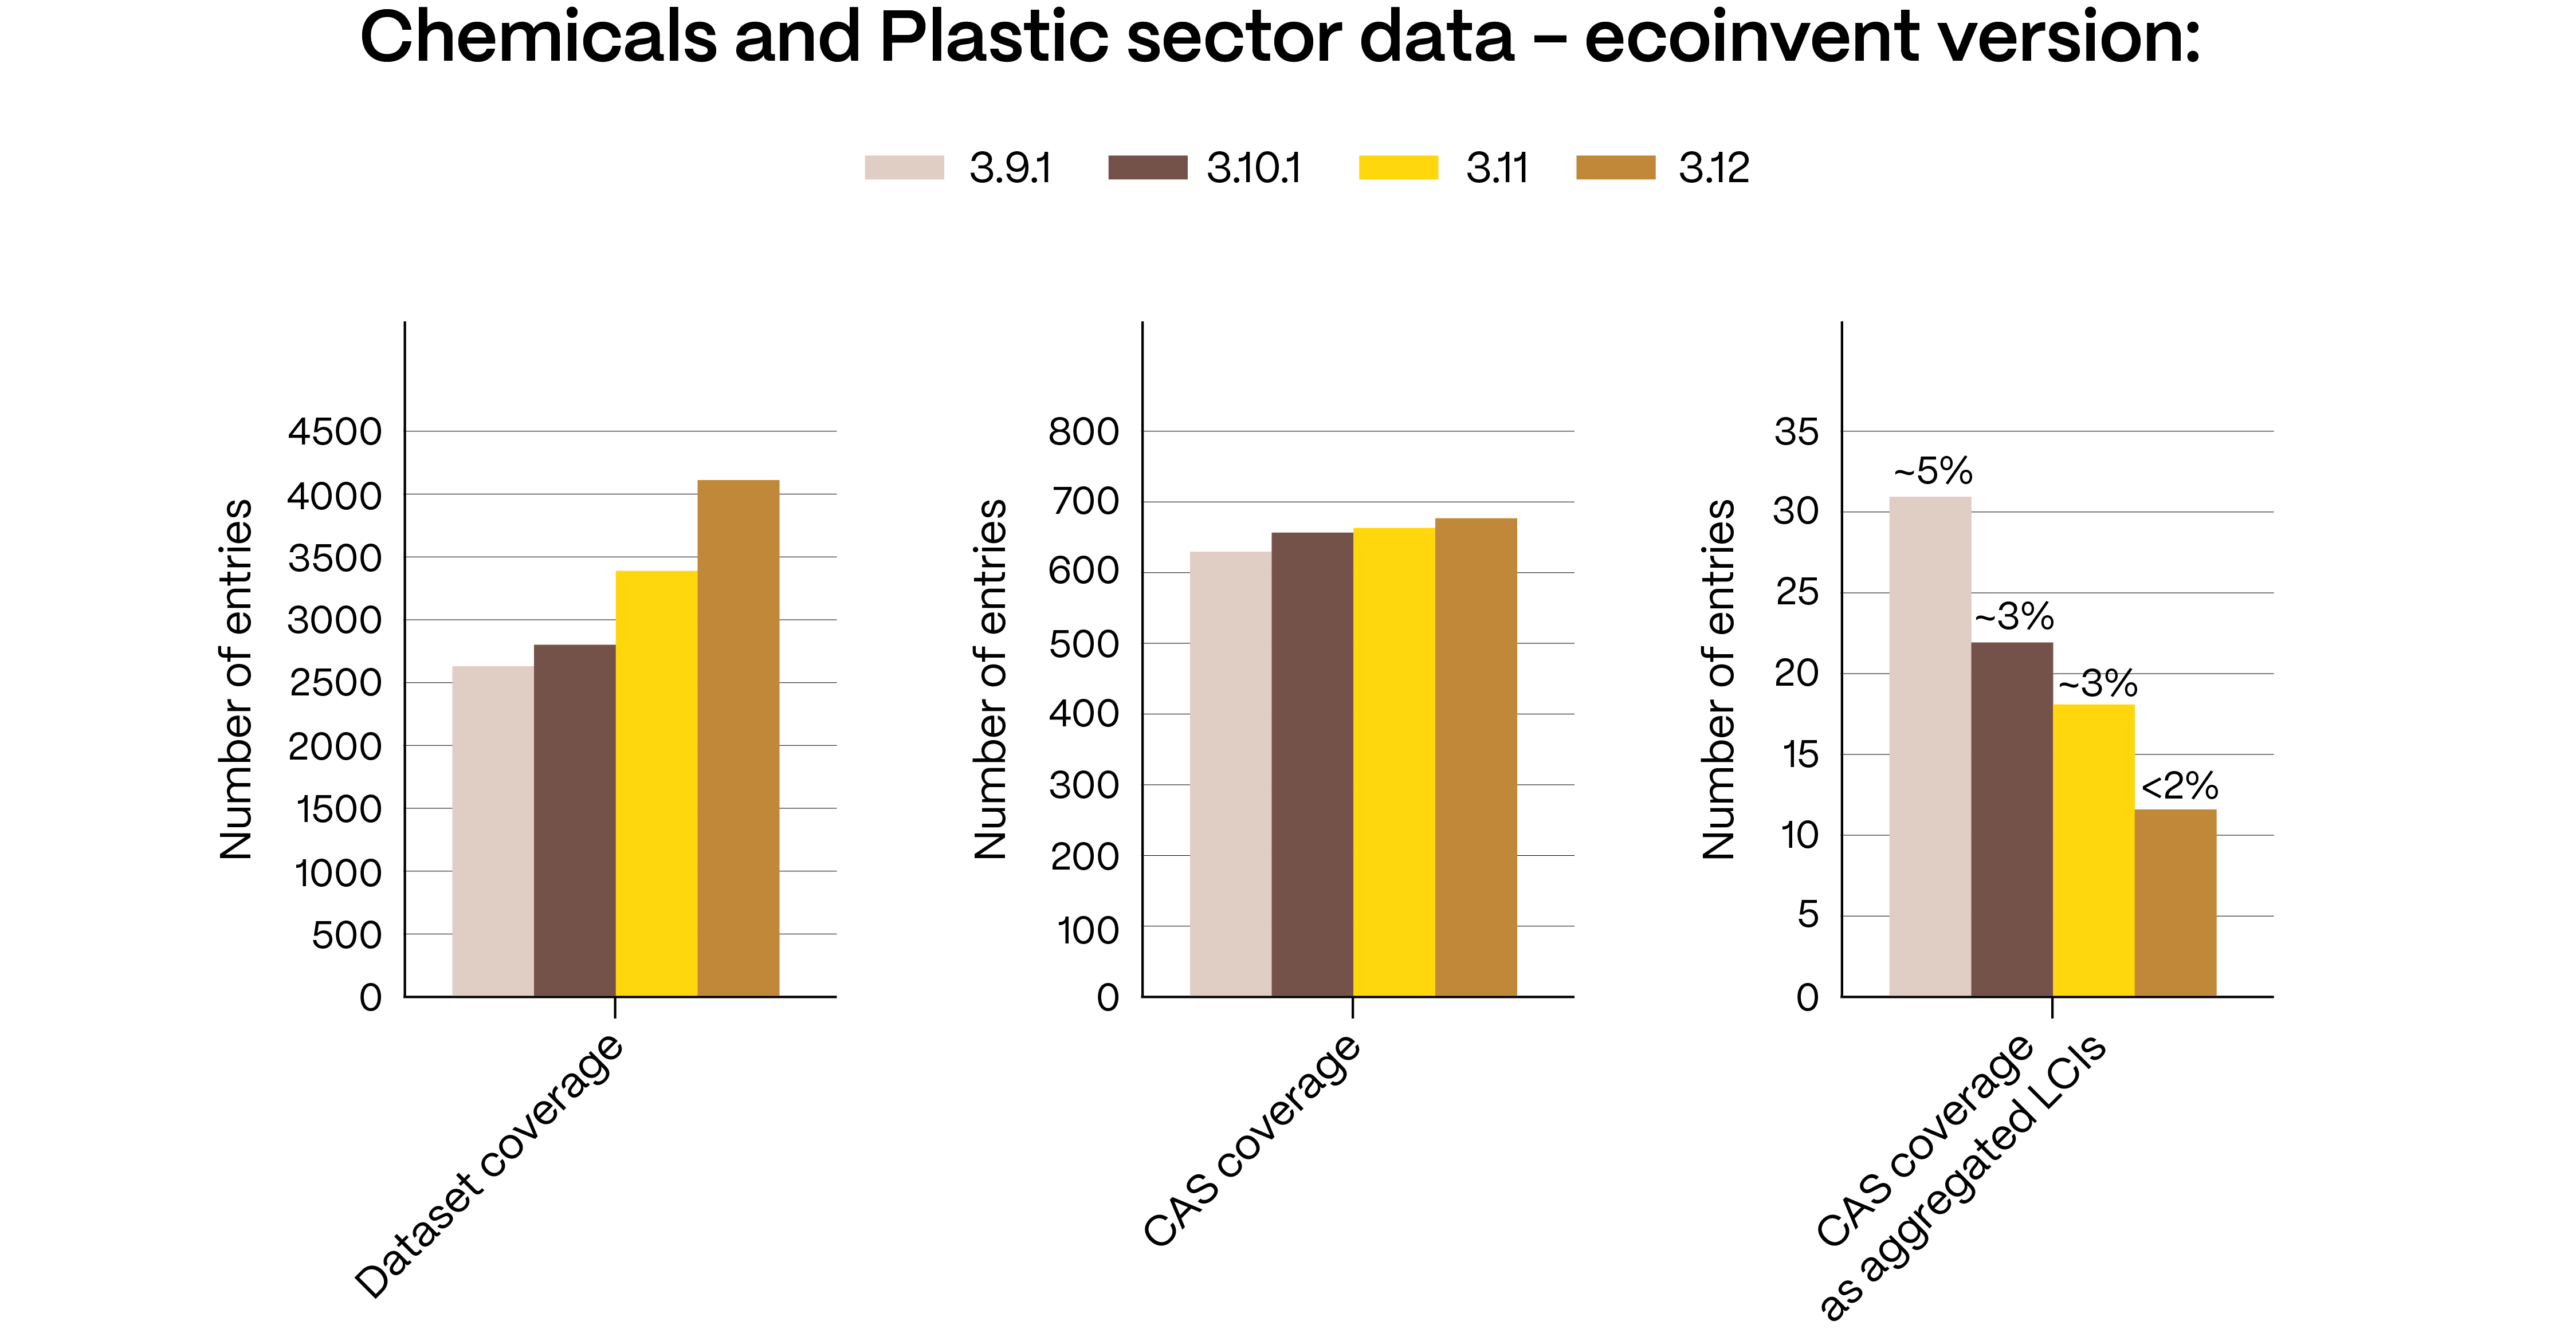
The overall dataset coverage has grown substantially. CAS coverage has expanded too, reflecting the growing range of products covered in the database.


Note: CAS (Chemical Abstracts Service) numbers are unique numerical identifiers assigned to each chemical substance. CAS is the global standard, ensuring that for each substance, chemical information can be exchanged clearly across countries, industries, and languages without confusion.


At the same time, it is not only about adding more. While CAS coverage has grown, aggregated life cycle inventories for chemicals and plastics have progressively been replaced by more transparent unit-process datasets, resulting in a ~65% decrease in their share of CAS coverage between v3.9 and v3.12.


Then there is the geographical side of the development.


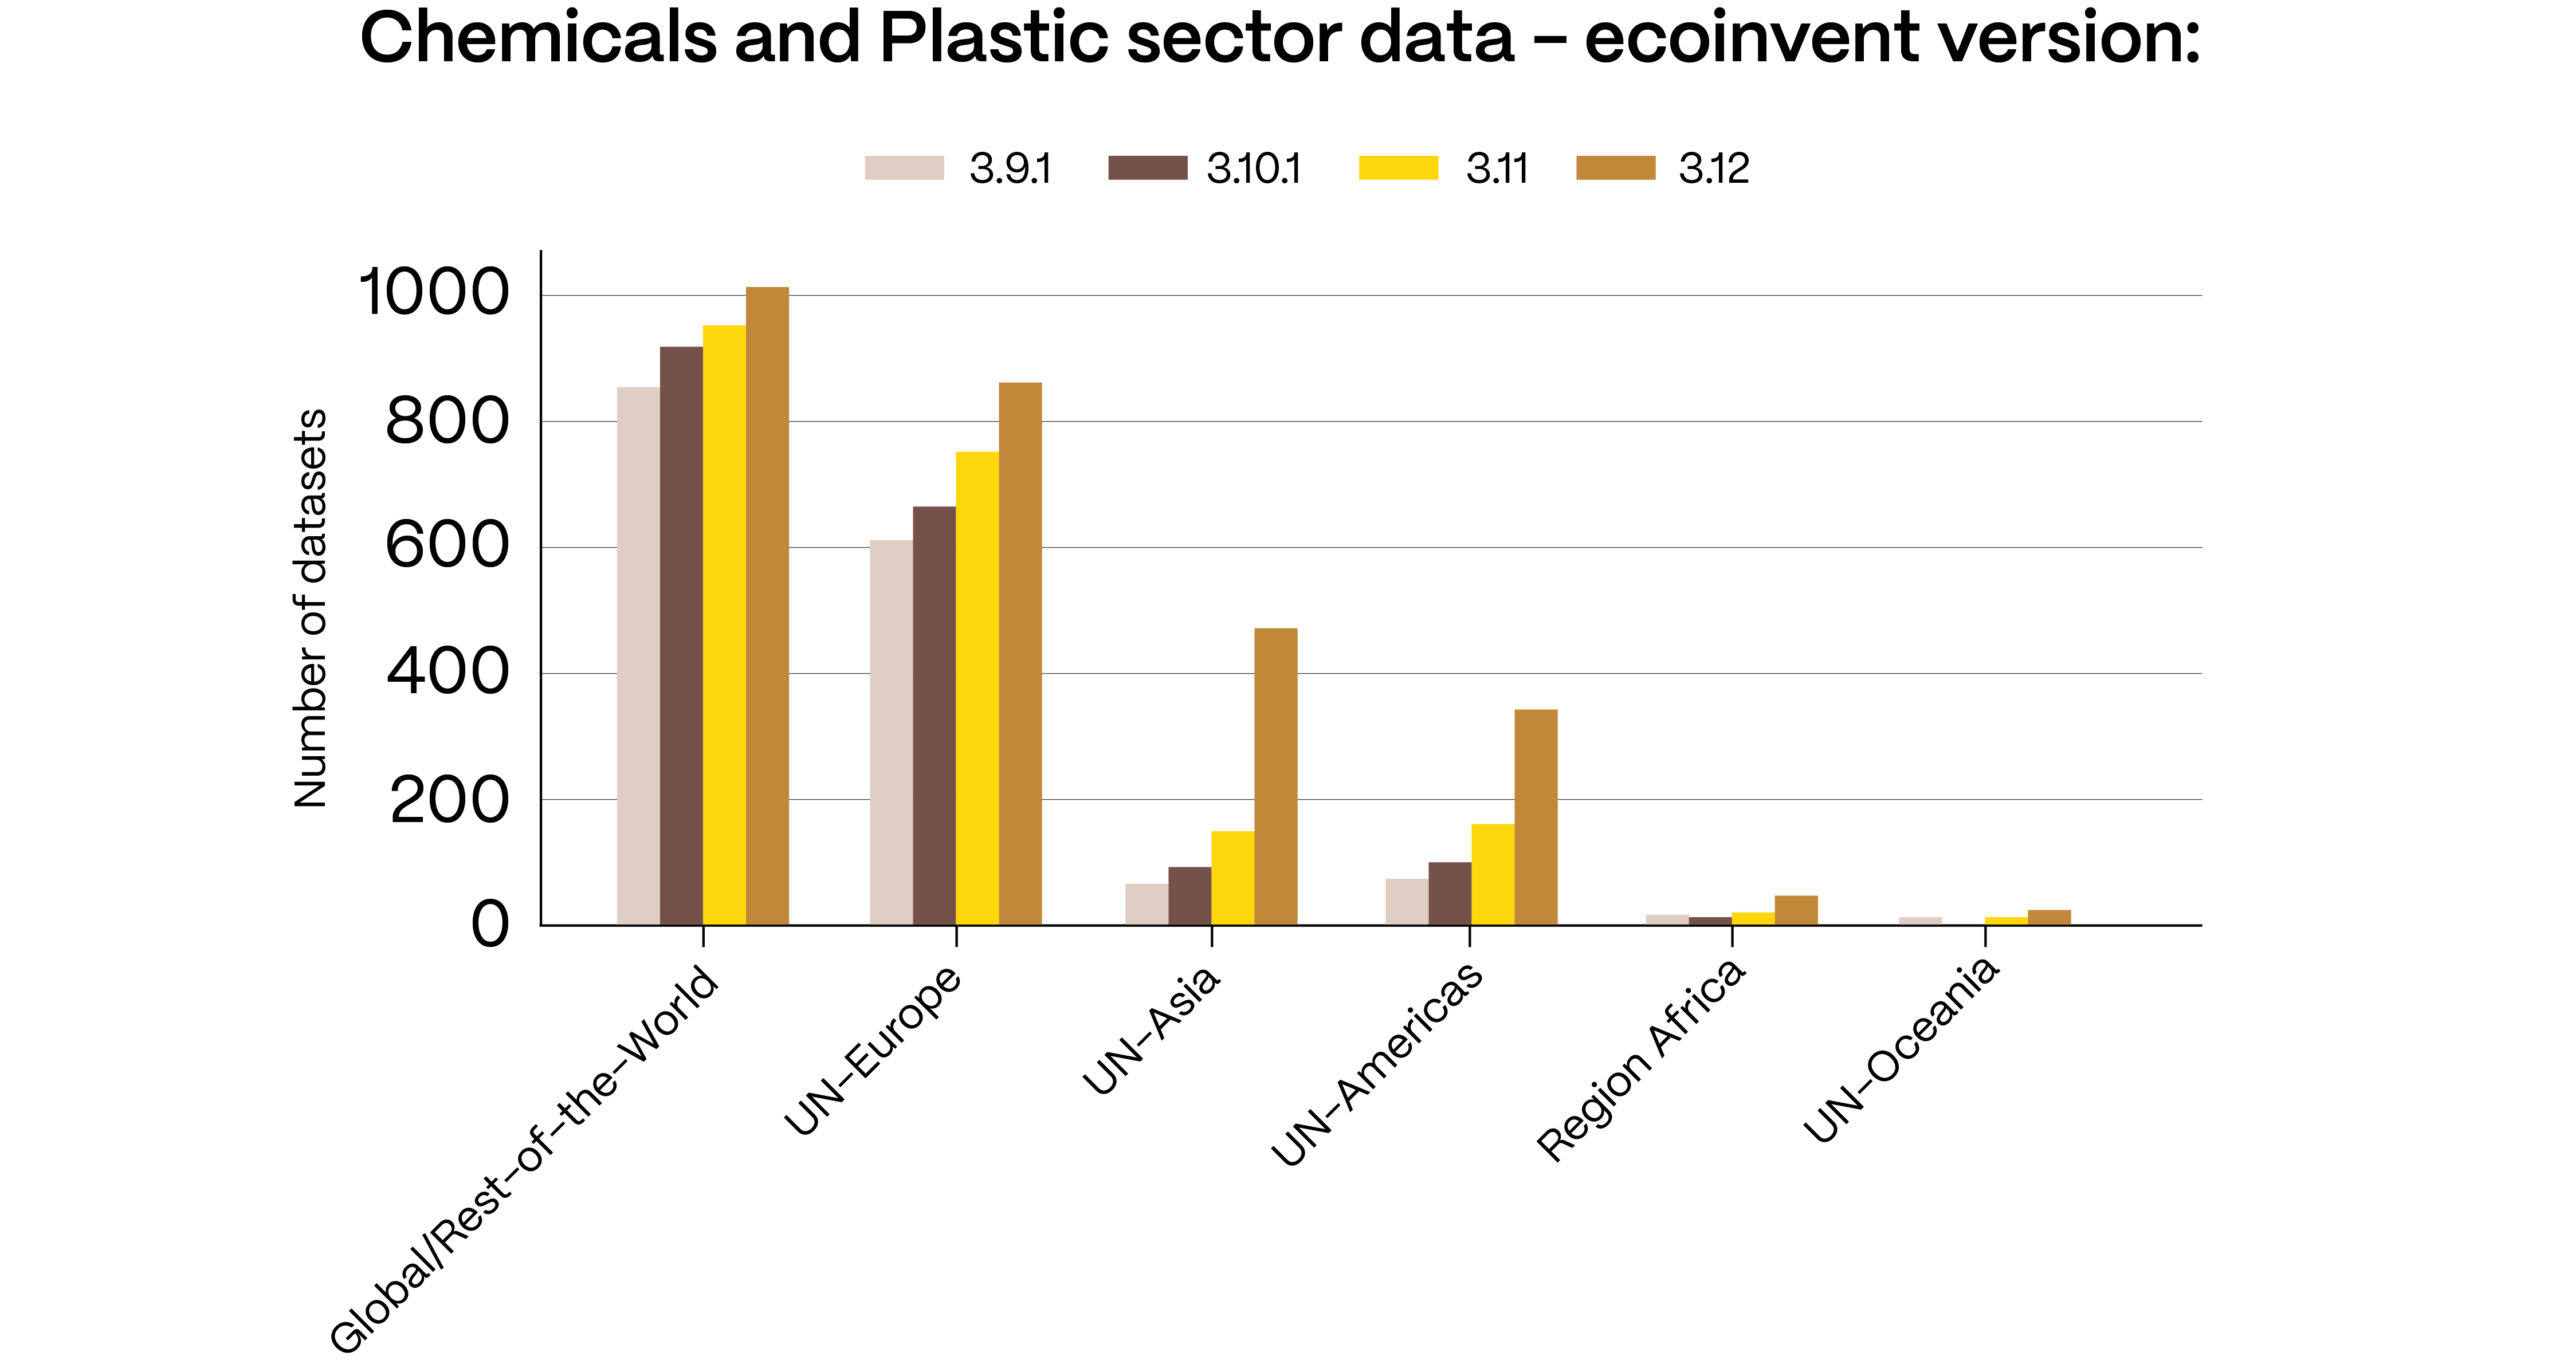
The content expansion has not been uniform across regions. While European and Global/Rest-of-the-World coverage has continued to grow, Asia and the Americas stand out for the scale of the expansion in recent releases.


Putting these numbers together gives a broader view of what has been happening across releases: broader chemical coverage, more geographical detail, and continued work on existing data.


And there is still plenty to do.


*Data shown for the Allocation, cut-off by classification system model.

chemicals v3.12 graph 1
chemicals v3.12 graph 2

In addition to this development, a lot of maintenance and update work happening in the background between releases isn’t captured in these graphs. LCI disaggregation is just one example of how we improve the database beyond simply adding new data.


Updating and replacing underlying data is a continuous part of our work, with several examples across the releases. We approach this systematically and from the bottom up: starting with an up-to-date foundation and then moving upwards in the value chain, from key raw materials and building blocks (e.g., light olefins, monocyclic aromatics and methanol), through intermediates to downstream plastics.


— Iasonas Ioannou, Database Content Lead, Chemicals and Plastics

What This Means

Broader chemical data coverage and more geographical detail mean that sustainability practitioners can create reports and assessments that are more specific to their operations and supply chains. By better matching their reality, our users can make more meaningful decisions about their environmental footprint.


For users working with LCA studies, EPDs or sustainability reporting, our efforts to progressively disaggregate the remaining aggregated data provide greater transparency into what sits behind their results, making the underlying inventory easier to understand and communicate. Disaggregation also allows changes across the wider economy to be better reflected across value chains as underlying data are updated. This can include evolving energy mixes and the uptake of renewable energy, as well as more significant shifts and disruptions.


Interested in more detailed updates? ecoinvent version 3.12 added more than nine hundred new datasets in the chemicals and plastics sector, significantly strengthening regional and product coverage. You can learn more about our 2025 data release in our chemicals and plastics deep-dive webinar.